Tuesday, April 25, 2006

NeXT: Not just GIS

Though GIS has been a part of my career since the early days that 's not the only thing I've had a deep or interesting involvement in. In my early days most of the work I did revolved around UNIX systems such as PDP11s, VAX 11/780s and Sun workstations. However for some work the new Mac Plus SE Platinum was just the ticket (first resume was written with it) and back in the same lab that I used for that had a Xerox Smalltalk machine as well. I never used that much but it, the Mac, and the fact that my advisor was heavily into CHI (Computer Human Interaction) certainly opened my eyes to the "power" of user interfaces.

Flash forward a bit to 1988. I'm at ANL and one of the other folks I work with and had been at school with has a friend going to work for NeXT. We are aware of NeXT and Steve Jobs from the Apple days. He is promising a Unix based workstation for education with UI features and capabilities above and beyond the Mac. Who wouldn't want in on some of that? On a cold day over Christmas break 1988 we await the first shipments of NeXT Cubes to Chicago outside the University of Chicago. One of those machines is "ours". We are delighted when one cube with NeXTStep (I think that was the capitalization at the time) 0.6 arrives!

After opening it up we can't help but be excited by the interface, a dictionary service on every machine, Display Postscript, the dock and the "black hole"! We were blown away. So much so that we "invented" a color version of NeXTStep before NeXT did (another story). Not only could we see the value of this computer for education but also for the types of projects we were undertaking. A client/server window system. Resolution independent text/graphics drawing. World on an Optical drive (Useful even today. Think SIM chips for phones and other systems that carry preferences around on a flash based medium). We decided to set out to create some original applications to the Cube and also to port some of our existing applications to the cube.

But this post isn't about any of that work (again something for later) but rather this: We had so bought into the "reality distortion field" around the product that we simply could not wait for this. Imagine my delight at getting this.


Yeah okay, completely a geek moment. But I still found it qite cool!

Monday, April 24, 2006

GIS... GIS... Wherefore art thou GIS?

Without my ever even really realizing it Geographic Information Systems (GIS) have been part of my background from the start of my working career. Please though, don't be like the rest of the hoi polloi and call anything with a map GIS. Oh no! There are plenty of vendors out there that cringe when you say "GIS" and they reply with a snooty... "mapping is not GIS". Welcome to the new world where a mashup is "GIS".

OK, that bit of soap box behind me:

I actually started working with maps back at ANL when I joined the Visual Interfaces Section. Our little part of ANL wasn't like you would think of a government lab. We weren't handed money from a line item that made it into the US Budget. Nope, we were almost exactly like consultants. So we went out in search of organizations within the government, DoE and DoD, that had line item funding and were looking for how to spend it.

Enter our group, which convinced a number of folks that the new affordable computer craze (Sun workstations were starting to be seen as reasonable computing platforms) could help them visualize the reams of tabular data output from their models into more concise visualziations on maps. The military had models like TACWAR and AEM that took many input files and generated a model of a conflict between forces. Our idea: Put icons on maps and let you click on the icons and present the tabular information in windows that popped up as a result of those clicks. Cool!

Back in those days our development environment consisted of running SunView and using either vi in a shell window or textedit. Sad to say I had not yet been exposed to Emacs and the benefits of integrated GDB debugging. However Sun did have dbxtool and a decent version of make to help us create the applicaitons we wanted. Usenet groups had plenty of SunView programming knowledge and the documentation as well as the APIs seemed quite reasonable. I think the first set of machines I started on were Sun 3/260 boxes along with 3/50 and 3/60 boxes. These machines had the good old Motorola 68K processors in them and had resonable speed (OK not the 3/50 but then with only 4MB of memory and booting and swapping over the network you couldn't really expect it to). Most of the development was done on the 3/260 because it had the most amount of memory and a color display which was kind of important to draw good looking maps.

So one of the first applicaitons we did was put a little GUI front-end on the output of a model run. Show a map of the area, show little icons denoting forces, airbases, and what all, have an inidcatior allowing you to move forward in time of the model run and be able to click on icons to bring up information about them. Here's a sample picture (Please Note: Any and all images associated with the work I did were all generated from unclassified SAMPLE data! I never had access to anything else.)


As you can see there are coastlines and some rudimentary country boundaries being drawn along with the icon overlays. At this point the idea of how to build all this seemed fairly simple. But there were still two significant problems. The first was that we wanted the icons on the display to be animated and we didn't have a high-end graphics board in any of the machines at the time. The second, and far more limiting issue, was that none of us had any background whatsoever in the field of GIS! What is the difference between a projection, datum, or a coordinate system? There was plenty to learn!

First thing we had to do was settle on a projection and after reading up on a number of them we chose the Mercator projection because it was simple and it looked good when you were zoomed in a reasonable amount. It wasn't until quite a bit later that we learned about all the headaches with the aforementioned projections, datums and coordinate systems though we did support UTM fairly early on (as depicted above). Now we had to figure out how to draw the maps on screen. The early Sun framebuffers were 8-bit colormapped(indexed color) displays that allowed us to load the colors we wanted. But to animate the red and blue forces we had three choices.
  1. Use double buffering
    1. Our graphics card did not support double buffering :(
  2. Use XOR technique
    1. Unfortunately this causes colors to go all "disco" on you as something is drawn over something else and moves. It also presents somewhat of a problem when many things are moving at once.
  3. Draw as fast as you can
We had to settle for #3 with the standard "flicker" involved. We were at least able to cache the projected and drawn image in a pixrect to speed the background blit but it was a "wavy" kind of animation. Mission accomplished!

Only one problem. Our sponsor was coming to visit and we were giving a high profile demonstration of all our work to them. This wasn't working. Something in the input files was causing the application to bus error. Not segmentation fault, bus error! Major bummer! It is now the morning of the demo and our sponsor is there. The only machine(s) that can run the program are in the room that all the demos are going to be done in. I'm up about 2 hours in. I go sit down in the demo room and I sit down at the only other machine that can run the application. It is immediately to the right of the demo machine. I grab the monitor and pull it as far right as possible and start debugging with dbxtool! The demos start and after the first one completes Bob shoots me a knowing look with raised eyebrows. Done yet? I just shake my head no. I keep debugging. The sponsor looks over at me a couple of times. I slide my chair a bit further to the right (the room was small) and pull the monitor even more to the right. I keep debugging. About 15 minutes before I'm up I figure it out. I can't recall the exact problem but I do recall it was a stupid problem and wanting to blurt out an obscenity as I figured it out. I barely contained myself.

The demo went off without a hitch and more $$ kept flowing. Looking back on it I can't help but laugh at the experience. There were more like that. I had the pleasure of working with some great folks in our military during this time both at the Pentagon and at US Central Command. Stories for another time but I can't leave without giving you a hint of one of those stories. It revolves around the 13th and 14th octets of an Ethernet packet and US Central Command.

Sun Framebuffer History
Segmentation Fault vs. Bus Error why a bummer?

Found an Image


Recall the hybrid maps I was talking about. I happened to find an old image of the app with a satellite overlay. This was the XView version that we had worked on so this probably circa 1992 or 1993. Eat my heart out google maps! :)

Friday, April 21, 2006

Quintillion

So where did this McDonald's Quintillion come from? How did I get involved?

Second question first. I got involved because during that time, circa 1991, because I was working at Argonne National Laboratory and my immediate supervisor, Bob (all names will be first name only), happened to have a friend, Gary, who worked in the Marketing department at McDonalds. Now earlier in 1991 Bob (Smart Adult), David (Smart Kid#1), and I (Smart Kid #2) started a company together (We were later joined by Smart Kid #3 Gordon). Gary was looking for help in creating a mapping system to do analysis of existing stores and determination of where new stores should go. Oh... Did I mention that we spent the previous 3 years working on mapping systems for the DoD at ANL?!? (That is a bunch of stories for another time). I'm pretty sure that had some bearing on Gary thinking we could help him create the software he wanted. So one thing lead to another and next thing you know we are working for McDonalds on what was to become Quintillion.

First question: Where did it really come from though?

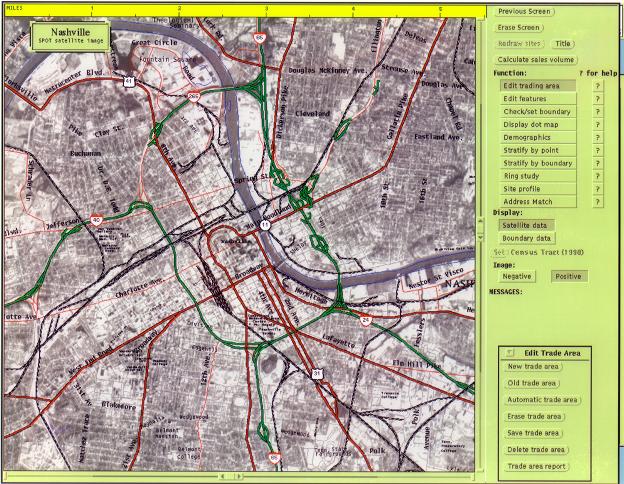
Well Quintillion, as it is known today, was really two different products. There was Impact: the executable that was responsible for determining what impact a placement of one store would have on the trade areas of other existing stores and Speedy: the application that did geographic analysis of existing stores. Look at a map point and click and get lots of information about what you clicked on.

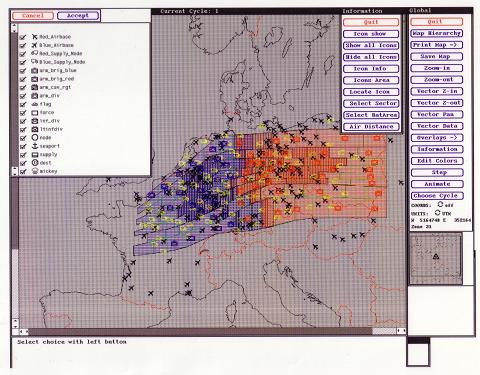
Here are a couple examples of what I'm talking about, see the link below for a more detailed view. On the left you see what I think were impact rings and dot maps of where customers came from and how far they traveled. This information came from surveys done in-store and then feed into the system.

On the right you see one of the cooler comparison tools that we (The royal we. I don't recall whose idea this actually was.) came up with. It allowed us to compare how two stores were doing in comparison with some other computed metric. It made it very easy to overlay stores and see how they matched up in key metrics and what made a store good or bad.

Great you say. What's so special about it? Well first off, do you realize that McDonalds is an absolutely huge real estate company? If folks that own land find out McDonalds is interested in land the price goes up. If competitors find out they buy up land before McDonalds has a chance to run all it's due diligence. It is simply amazing how many dollars are associated with real-estate transactions at McDonalds. And I'm not just talking about just in the US either! It therefore seemed like it would pay if the market managers could have an automated way of seeing information about their current stores and weighing information about future sites. Apparently there weren't that many folks doing this type of GIS integration back then. There were GIS applications from the players you would be familiar with today but none that really provided such an integrated vertical solution. A custom app was deemed the best solution and it actually wasn't started by us. A couple of other guys started the development and our team took over after the initial team had some issues. How come the McDonalds IT department wasn't doing the development? That is a long and interesting story in and of itself that I will cover some other time. Suffice to say that the belief was the talent and ability to execute to the timeframe wasn't there.

The applications themselves were initially developed on a Sun workstation in C utilizing the SunView window system. The underlying data to create the vector maps could have come from a number of sources but it turned out that the easiest solution was to utilize the US Census TIGER data files. Now there were/are plenty of problems with the data in these files but for the purposes we were using it for it worked great. During development it was also asked to overlay the vector maps on top of satellite imagery (Google Hybrid view anyone?). Our team developed the algorithms to convert the map projections to a common format and warp the image data to the selected projection to allow for very accurate overlay. Store data was ground-truthed in a couple of ways. Initially we would find the street or cross roads a store was located on and then then using the map click the point to register the lat/lon where a store icon would appear. Later we were also able to utilize a GPS receiver. We also associated picture information of the store (layout, exterior, interior shots) to the store icon on the map and then began the work of associating the information obtained from in-store surveys with it as well. All this information was then available with just a couple of clicks. This lead to some fascinating discoveries in our pilot markets (Dallas, Nashville? and Washington DC?) such as: how people wouldn't cross railroad tracks to visit a store that was closer to them than another, how economic boundaries can act like physical ones, the impact of large corporation or college campuses on stores and their business and many more.

On the technology side, things continued to evolve. Because of internal politics between the Marketing and IT groups it was necessary to port the application from the initial Sun/SunView platform to a more portable, and therefore politically acceptable, Unix/X-Windows system. It also required us to be able to run the client on a PC. This was accomplished by utilizing the XView toolkit for porting SunView applications to the OpenLook GUI for X-Windows. Then we had to port the Sun specific build environment and code segments to more generic cross-platform Unix calls (stuff like bcopy and memcpy, vfork etc...) and finally make it work on a little-endian system to boot. The IT group had "challenged" the team to support many platforms already within the business. which meant the server code ran on Sun, Ultrix and AIX and the display/client ran on those as well as a PC.

What that means is that we dealt with code to handle big/little endian issues in both server and client code. X really sucked when it came to images. Colormaps, overlays and pixmap byte orders though somewhat portable in reality still had to be specifically hand coded (Java anyone?!?) to the existing servers you were running against. The major problems were the DEC server and the PC Hummingbird X server and the paltry memory available on the PC. Now the PC was state-of-the-art at the time but it was still just a 33Mhz 486 with an 8-bit ATI graphics card. It had a state of the art EISA bus, sigh, and it ran the brand-new Windows 3.1 and the Hummingbird X server. Very little memory (especially to display the satellite pixmap overlays) caused most of our problems with this setup but we fought with driver issues for both the network and video cards.

In time, as we looked to create the next generation of the application, we were porting it to XView3 (from the original XView2 port) integrating with a custom object oriented database to help with the object model we had created and finally creating a "bridge" to ingest data from Oracle databases (which customers seemed to have/ask for).

In hindsight none of this stuff seems quite so *wow* anymore but back then we were doing stuff that very few others had really undertaken. In the end the product ended up with Dakota (see link below). In a future post I'll talk about how close we came to spinning out a stand-alone company to sell Speedy/Impact, some of the potential customers we created custom demos for, the political intrique that was behind the creation of the product and how it ultimately ended up where it did.

The Dakota Quintillion web site

Wednesday, April 19, 2006

What prompted this?

It was recently that I had the opportunity to sit in a hospital waiting room waiting for hours to hear what the outcome of a surgery was. As I tried to while away the hours I finally broke down and started to read the various magazines laying around. Lo and behold I find a Wired magazine and start to flip through it. As I do so my eyes land on an article:

"Better Directions: Digital maps are changing how we navigate our lives".

Hmmmm.... Interesting. I've worked with digital mapping in the past so let's see what we have here. I continue to read and find this...

How did we get here? This technology used to be top-secret government stuff. Then, in the 1980s, McDonald's dumped thousands into buying satellite images and developing software called Quintillion, which predicted the growth of cities and school districts. Ever notice there's always a McDonald's where you'd expect one? The company looked down from the heavens and dropped new franchises wherever it saw the right combination of kids, interstates, and suburbs, using one of the first geographic information systems for business analysis.

Then just today I read an article on News.com that talked about this...

Real estate prime for mashups
Most likely to get venture backing are companies like Zillow.com, which blends a mashup with several other services and home-property valuations and data from different sources. It recently landed a $32 million investment from Benchmark Capital.

Hey!
I helped develop that McDonalds thing! Not only that but I helped to develop some of that top-secret government stuff they refer to earlier as well! And I ultimately left Argonne when a map based real-estate Java Applet that I had developed was deemed as uninteresting by Argonne's technology transfer organization!?!

Now this was all a long time ago and it has slowly dawned on me that for much of my career I've had some very interesting experiences but they have almost always been failures to some degree or another. Though I've never actually invented things such as the Internet, Java, Interactive maps, Web browsers, or a plethora of other things I have been around and involved in the these activities during their formative years in some bizarre way or another.

So I decided that this is the right time to go ahead and write about some of my experiences then and now. I realize that this is going to be strictly from my own point of view so it will have some biases and inaccuracies but I'm doing this as a way for me to remember some of the fantastic times I've had the pleasure of being a part of and hopefully amuse others that stumble across it.

In the coming days/months/years I'll cover more background on the McDonalds work, my mapping work at Argonne prior, my involvement in Desert Shield, the time I spent at Spyglass working on that internet and browser thing and hopefully many more stories that are interesting both technically and historically.

Find the original Wired article here.
Find the original News.com story here.